
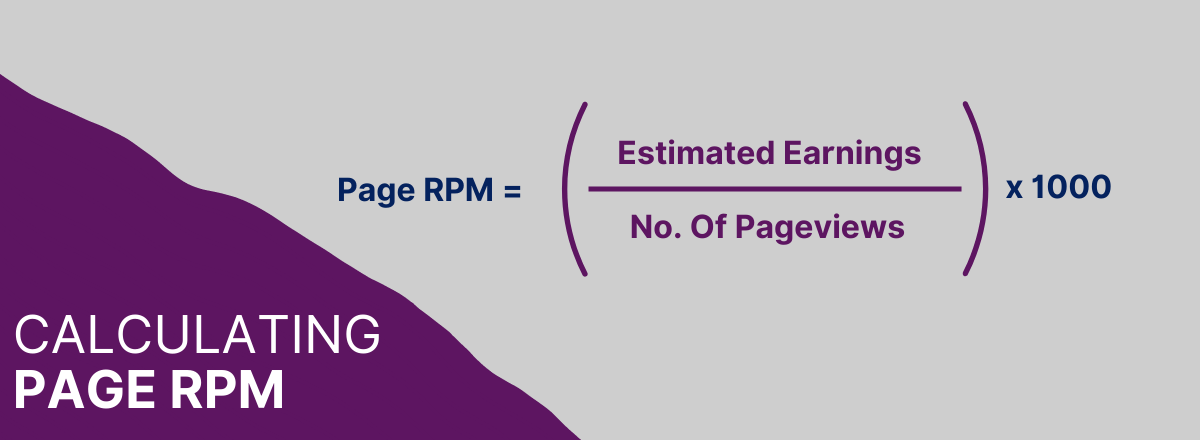
Page RPM is the rate that an advertiser pays the publisher following every 1,000 ad impressions viewed per page. Publishers can calculate Page RPM by dividing the estimated revenue by the number of page views they receive and then multiplying by 1,000.
For example, if you earned an estimated $0.18 from 25 page views, then your page RPM would equal ($0.18 / 25) * 1000, or $7.20
Page RPM is one of many tools that publishers have to track their revenue generation across their digital platforms. Page RPM is a valuable metric to identify any issues in the effectiveness of digital advertising campaigns too.
Page RPM and eCPM are related metrics, but they measure different things. Confusing them leads to flawed reporting decisions.
Page RPM vs eCPM: What Is the Difference?
eCPM (effective cost per mille) measures estimated revenue per 1,000 ad impressions. It is a per-unit metric. It tells you how each individual ad slot is performing.
Page RPM measures estimated revenue per 1,000 page views. Because a single page typically carries multiple ad units, one page view generates multiple ad impressions. Page RPM rolls all of that up into a single figure at the page level.
The practical difference: a page with three ad units at a $5 eCPM each will show a higher Page RPM than a page with one ad unit at the same eCPM. Page RPM is sensitive to ad density in a way that eCPM is not. This matters when you are diagnosing a revenue problem. Whether it sits at the unit level or the page level will point you toward different fixes.
What Affects Page RPM?
Several variables combine to determine your Page RPM. The main ones:
Ad Density
More ad units per page means more impressions per page view, which increases Page RPM up to a point. Beyond that point, ads compete with each other, viewability falls, user experience degrades, and buyers begin discounting your inventory — which suppresses Page RPM over time.
CPM Levels From Demand Partners
The CPMs being bid by advertisers on your inventory flow directly into Page RPM. Higher CPMs mean higher Page RPM, all else being equal. This is influenced by your content niche, the geographic profile of your audience, and the quality and number of demand sources connected to your stack.
Fill Rate
An unfilled impression earns nothing. If your fill rate falls — because floors are set too high, demand is thin, or there is a technical issue in your ad setup — Page RPM falls with it. Fill rate and CPM work together: a high CPM with a low fill rate can produce a worse Page RPM than a moderate CPM with a high fill rate.
Viewability
Buyers pay less, or not at all, for ads that are not seen. Ad units in low-viewability positions attract lower bids over time as buyers learn to discount that inventory. Improving viewability — through placement, format, and page speed — raises the CPMs your inventory can command.
Demand Competition
The more buyers competing for each impression, the higher the clearing price. Running a single demand path (one SSP, or Google alone) means less competition and lower CPMs. A header bidding setup with multiple demand sources creates a genuine auction, which consistently produces higher CPMs than a waterfall arrangement.
How These Variables Combine: A Worked Example
The table below shows how CPM, fill rate, and ad units per page interact to produce different Page RPM outcomes across five scenarios. The formula in each case is: Page RPM = CPM × Fill Rate × Ad Units Per Page.
| Scenario | Avg CPM | Fill Rate | Ad Units / Page | Page RPM |
|---|---|---|---|---|
| Single demand path (no header bidding) | $1.20 | 70% | 3 | $2.52 |
| Header bidding, 3–4 SSPs connected | $2.40 | 85% | 3 | $6.12 |
| Header bidding + optimised price floors | $3.00 | 80% | 3 | $7.20 |
| Same setup, higher ad density | $2.80 | 80% | 5 | $11.20 |
| Ad density too high — viewability drops | $1.60 | 74% | 6 | $7.10 |
The jump from Scenario 1 to Scenario 2 shows what header bidding does to demand competition. The drop from Scenario 4 to Scenario 5 shows what happens when ad density crosses the point at which viewability and CPMs start to suffer. More ad units do not automatically mean more revenue.
Should Publishers Focus on Page RPM?
The results of calculating page RPM push publishers to focus on an ad’s page-level performance. It can help publishers plan for more specific optimisations across their pages, such as the layout, the number of ads on a page, the impact of lazy loading and more.
Whilst we firmly believe in a RPM based on Google Analytics pageviews, focusing on page RPM as reported in advertising platforms on its own is dangerous. Despite its usefulness as a measurement, it can be misleading. A way to increase your page RPM is to block traffic from your lowest-performing pages. Whilst this might make the statistic look better, in reality, you are earning less money.
Relentlessly chasing an increase in page RPM can convince publishers to force too many ads onto the user. If too many ads are placed on a page, then the user experience will see a sharp decrease. The follow-on from this is that users will increasingly employ ad-blocking extensions and discourage users from exploring other pages on the site, or from returning to your site at all. User Experience needs to be congruent to digital ad placement to ensure consistent revenue.
A decrease in page RPM can come as a result of an increase in site traffic; as a publisher, this means your overall advertising revenue will increase. Your page RPM must be incorporated with other reporting metrics to properly understand the income of your site and how best to maximise the revenue in the future.
What Is A Good Page RPM?
What defines a ‘good’ page RPM will differ from company to company. A good RPM can depend on factors like the niche of your media, the quality of both your on-site content and your traffic, where users most commonly browse your site from and whether you are impacted by seasonal demand.
To find out a ‘good’ RPM, metrics need to be compared to companies within the same niche to establish a benchmark.
As a rough guide, well-optimised sites in competitive niches typically see the following ranges under normal market conditions:
Finance and business: $10–$30+. High advertiser intent and strong programmatic competition.
Technology: $8–$20. Consistent programmatic demand and typically good viewability.
News and current affairs: $3–$12. Highly variable, depending heavily on geography and brand safety categorisation.
Lifestyle and entertainment: $2–$8. Lower advertiser CPMs, generally requiring higher volumes to compensate.
Health and wellness: $5–$18. Strong demand where content is not restricted by buyer controls.
Note that Q4 (October to December) inflates RPMs significantly across all verticals as advertiser budgets peak. January typically sees a sharp drop before recovering through the year. If your RPM sits consistently below the lower end of your niche range, the issue is almost always in your ad setup rather than your content.
How To Improve Page RPM
Increasing the number of impressions you serve per page view as a publisher can be as simple as increasing the number of ad units on a page. However, this is not your only option. Increasing the impressions per page through approaches like:
Balancing advertising with user experience
No one likes coming to a website to be barraged with obtrusive advertising material and notifications. It’s crucial to balance the content on your website with a healthy amount of advertising space. Paying attention to repeated visits will help publishers understand how their user experience is perceived.
Improving the speed with which your page loads
How your ads, site and other pages load is a key factor in increasing the user experience on your site and, by extension, ad visibility. Pay close attention to technical issues on your site that will inhibit the performance of your ads, such as broken links or rendering glitches. Technical problems will have a gradual effect and will accumulate, and these will both affect SEO which will have an impact on the page RPM.
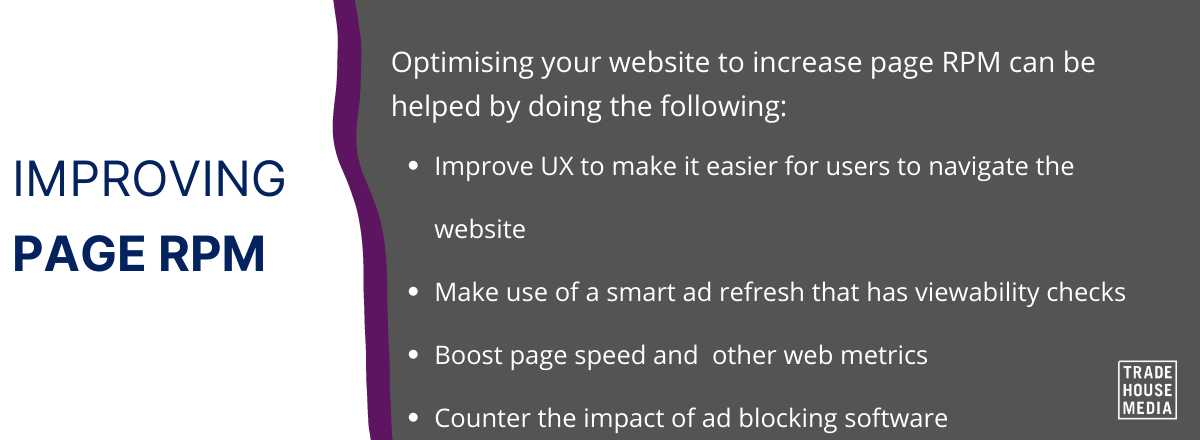
Adjust the ad formats and sizes on your pages
Whether you choose to display text, video, image, or expandable ads on your site, you will need to optimise these to best suit your site’s architecture and layout to boost revenue. Shifting all of your on-page ads to one medium will not increase your page RPM; you will need to experiment with what works best on your site. Some ad sizes are generally more effective and have inherently higher CPCs than others. So whilst you should continually experiment to find out the ad size that works best for you, wider advertising sizes do tend to have higher CPC.
Using smart-refresh strategies
With a refresh strategy, the publisher can present multiple ads to a single viewer. After the viewer has spent the set time on the page, or completed a specific action, the ad will be replaced and refreshed with a new one. CPC will be decreased, but page RPM will be increased.
Fluctuating Page RPM
As page RPM is only an estimation, it is common for the value to change. Focusing on day-by-day updates is impractical. Instead, publishers should monitor for trends and use rolling averages across reporting schedules.
Like any aspect of digital marketing, implementing changes will take time to affect page RPM. It is important to give the optimisation ample time to reveal its effectiveness. Continually evaluating performance, experimenting with new techniques, and re-optimising pages should be the priority for any publisher.
Page RPM: Not the Whole Story
Page RPM helps publishers connect their page views to actual revenue. Publishers should take page RPM seriously, as it is useful within its appropriate context. However, as there is no single metric that gives them the full picture, page RPM should be used in conjunction with the many other reporting tools available to publishers.